You signed in with another tab or window. Reload to refresh your session.You signed out in another tab or window. Reload to refresh your session.You switched accounts on another tab or window. Reload to refresh your session.Dismiss alert
Open the Console app from Applications > Utilities
Select User diagnostic reports from the Sidebar
Look a file starting with the name of the app/executable that crashed. In this example, ecore has crashed, the file is named ecore_2016-05-09-170911_iChrales.crash
Copy the entire text or just drag-and-drop the filename to the Finder
Send the crash report attached to your issue report
Searching system log messages in Console
Open the Console app from Applications > Utilities
Select All messages from the Sidebar
Type the name of the app/executable in the search field in the upper-right corner. In this example, we type ecore in the search field.
Select the filtered lines and copy them to the clipboard (cmd-C)
Paste (cmd-V) the log lines and save them to a text file and send the file attached to your issue report
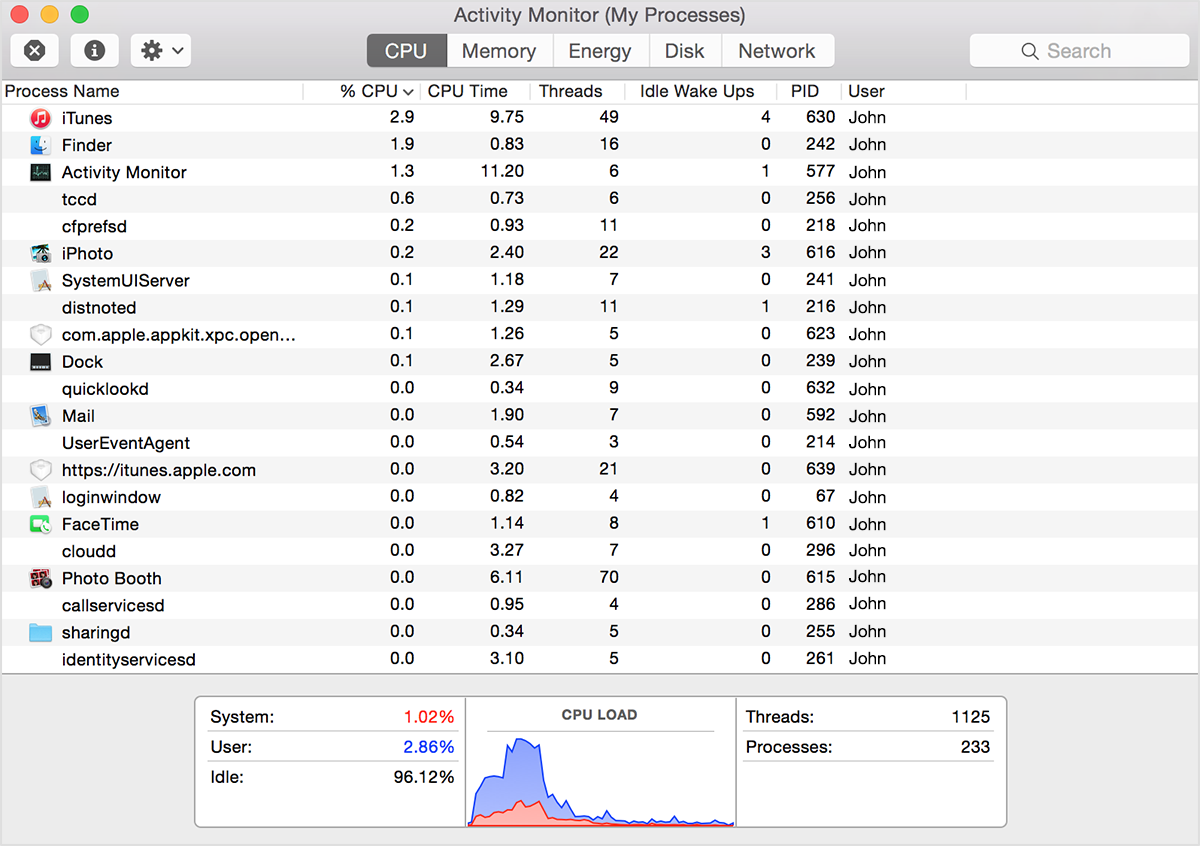
If your system is running slowly, perhaps a process is using too much CPU time and won't let other processes run smoothly. To find out which processes are taking up a lot of CPU time, you can use Apple's Activity Monitor.
The CPU pane shows how processes are affecting CPU (processor) activity:
Click the top of the “% CPU” column to sort by the percentage of CPU capability used by each process. If one of the top processes displays a large number (80-100% or more!) then this process may be hogging the CPU and preventing the other processes from doing their tasks. This can result in slow response times, beachballing and even some applications freezing.
A process with a high "% CPU" value is worth profiling.
A process that often freezes or beachballs, even though all other applications run smoothly and "% CPU" is very low, is also worth profiling.
Xcode Command-Line Tools
Profiling is much better with the Xcode tools installed. Instruments has a command-line interface to provide detailed profiling that can be opened in the Instruments application for investigation.
To check if Xcode Command-Line Tools are installed, open a Terminal and type:
xcode-select -p
to print the path of the current developer directory. If the command-line tools are installed, the output should be a path like the following:
/Applications/Xcode.app/Contents/Developer
If not, an error message is output:
xcode-select: error: unable to get active developer directory, use `xcode-select --switch` to set one (or see `man xcode-select`)
To install Xcode Command-Line Tools, type:
xcode-select --install
Profiling with Instruments
If Xcode Command-Line Tools are installed, it is best to use Instruments to profile your application. If Xcode Command-Line Tools are not installed and you would rather not install them, skip to the next section for profiling with sample. In this example, we will show how to profile ecore.
First, we need to find the process ID (PID) of ecore. Open a Terminal and type:
ps aux | grep ecore
and you should see something like this:
user          5773   0.0  0.0  3183424   9088   ??  S     2:47PM   0:09.00 /Applications/Lima.app/Contents/MacOS/ecore [...arguments...]
user          6543   0.0  0.0  2432772    648 s006  S+    4:32PM   0:00.00 grep ecore
The first entry is the currently running instance of ecore. (We'll ignore the second entry as it is only an artifact of the actual search). The second column is our PID., in this case 5773.
Now that we know the PID, it's time to create a time profile for ecore. Type the following in the Terminal:
instruments -l 30000 -t Time\ Profiler -p 5773
After 30s (30'000ms), instruments will save the profile to the Desktop and exit with a message indicating the name of the latest profile file. This file can be opened in Instruments or forwarded to a developer to understand what performance issues have arisen in ecore on your computer.
Profiling with sample
sample is a much simpler tool than Instruments. However, its simplicity is also why it is included in a standard Mac OS X installation. To profile ecore using sample, first find ecore's PID (see above). For this example, I will assume that the PID is still 5773. Open a Terminal and type:
sample 5773 30 -file ~/Desktop/ecore.sample.txt
This will sample process 5773 for 30s and write the profile to the given path. This file can be opened as text or forwarded to a developer to understand what performance issues have arisen in ecore on your computer.
Improving your sample
Under the hood, sampling checks your process every 1 ms and reports what your process was doing at the time. The data might not always be pertinent.
For example, if your process sleeps a lot or is never scheduled to run by the operating system, then no sample is taken. Luckily, you can always tell the kernel that your process is important and should be scheduled more often than others. Use renice for that. For example:
sudo renice -20 -p 5773
This will set the scheduling priority of your process to the maximum.
If you are using profiling to diagnose a specific operation in your process like drawing a view or listing files, you need to make sure the specific code is triggered as often as possible (by refreshing the view a lot, or performing a lot of ls) during the sampling period.
If none of these options yield better results, or do not apply to your case, it is always possible to extend the sampling duration. 30 seconds seems a bare minimum and you will always get more data if you sample longer.
In order to understand a problem on Mac, it is sometimes useful to get a full system diagnostics. Apple provides an interface to generate extensive diagnostics about many system services and features. To generate a full system diagnosis, follow these instructions.
Open Applications > Utilities
Launch Activity Monitor
In the toolbar, click the “options” button, and select “Run System Diagnostics…” from the drop-down menu
Read the warning, and press OK
Enter your password
Wait for system diagnostics to finish
When the system diagnostics are finished, a Finder window will open
Choose the file with name similar to sysdiagnose_2015.11.18_14-36-34+0100.tar.gz and send it to customer care.
[French] non-tech (sample) version : profiler une application.
Ouvrez votre moniteur d'activité sur votre Mac. Le pannel CPU montre comment les processus en cours affectent l'activité de votre processeur :
Cliquez en haut sur la colonne "% CPU" pour ranger les processus par pourcentage de capacité CPU. Si celui qui arrive en haut montre un grand nombre (80-100% ou plus), cela peut surcharger le processeur et empêcher les autres processus de fonctionner. Cela peut avoir comme résulttat un ralentissement général de votre système avec des temps de réponse longs, des roues de chargement (
) récurrentes voire des applications qui bloquent.
Il est intéressant de profiler un processus qui a une grande valeur de "% CPU".
Trouvez ensuite l'identification du processus (PID) de ecore. Ouvrez un terminal et tapez : ps aux | grep ecore
Et vous devriez trouver quelque chose comme user 5773 0.0 0.0 3183424 9088 ?? S 2:47PM 0:09.00 /Applications/Lima.app/Contents/MacOS/ecore [...arguments...] user 6543 0.0 0.0 2432772 648 s006 S+ 4:32PM 0:00.00 grep ecore
La première réponse est l'exécution en cours de ecore, et la deuxième colonne de cette entrée est votre PID, ici "5773".
Ouvrez un terminal et tapez en remplaçant "5773" par votre PID. sample 5773 30 -file ~/Desktop/ecore.sample.txt
Cela va échantilloner le processus 5773 pendant 30 secondes et écrire le profil du chemin d'accès vers le fichier souhaiter. Ce fichier peut petre ouvert comme texte si vous le souhaitez, mais surtout : pouvez-vous nous le transférer en pièce jointe à ce mail s'il vous plaît ?
$ instruments -l 30000 -t Time\ Profiler -p `pgrep openocd`
`instruments` is now deprecated in favor of 'xcrun xctrace' (see `man xctrace` for more information on its replacement)
Some system processes like WindowServer are not profilable in Instruments.
You can trigger sysdiagnose(1) from keyboard: Control-Option-Command-Shift-Period (src: x-man-page://1/sysdiagnose). You may also want to take a tailspin(1) whose data can be viewed by ktrace(1), fs_usage(1), and spindump(8).


[French] non-tech (sample) version : profiler une application.
) récurrentes voire des applications qui bloquent.
Il est intéressant de profiler un processus qui a une grande valeur de "% CPU".
ps aux | grep ecoreEt vous devriez trouver quelque chose comme
user 5773 0.0 0.0 3183424 9088 ?? S 2:47PM 0:09.00 /Applications/Lima.app/Contents/MacOS/ecore [...arguments...] user 6543 0.0 0.0 2432772 648 s006 S+ 4:32PM 0:00.00 grep ecoreLa première réponse est l'exécution en cours de
ecore, et la deuxième colonne de cette entrée est votre PID, ici "5773".Ouvrez un terminal et tapez en remplaçant "5773" par votre PID.
sample 5773 30 -file ~/Desktop/ecore.sample.txtCela va échantilloner le processus 5773 pendant 30 secondes et écrire le profil du chemin d'accès vers le fichier souhaiter. Ce fichier peut petre ouvert comme texte si vous le souhaitez, mais surtout : pouvez-vous nous le transférer en pièce jointe à ce mail s'il vous plaît ?